Russia's Trade Surplus Falls 8.2% in 2025 as Exports and Imports Both Decline
Russia's positive foreign trade surplus fell 8.2% to $139.3 billion in 2025 as exports declined 3.7% to $418.3 billion and imports eased 1.4% to $279.0 billion, Federal Customs Service data show.
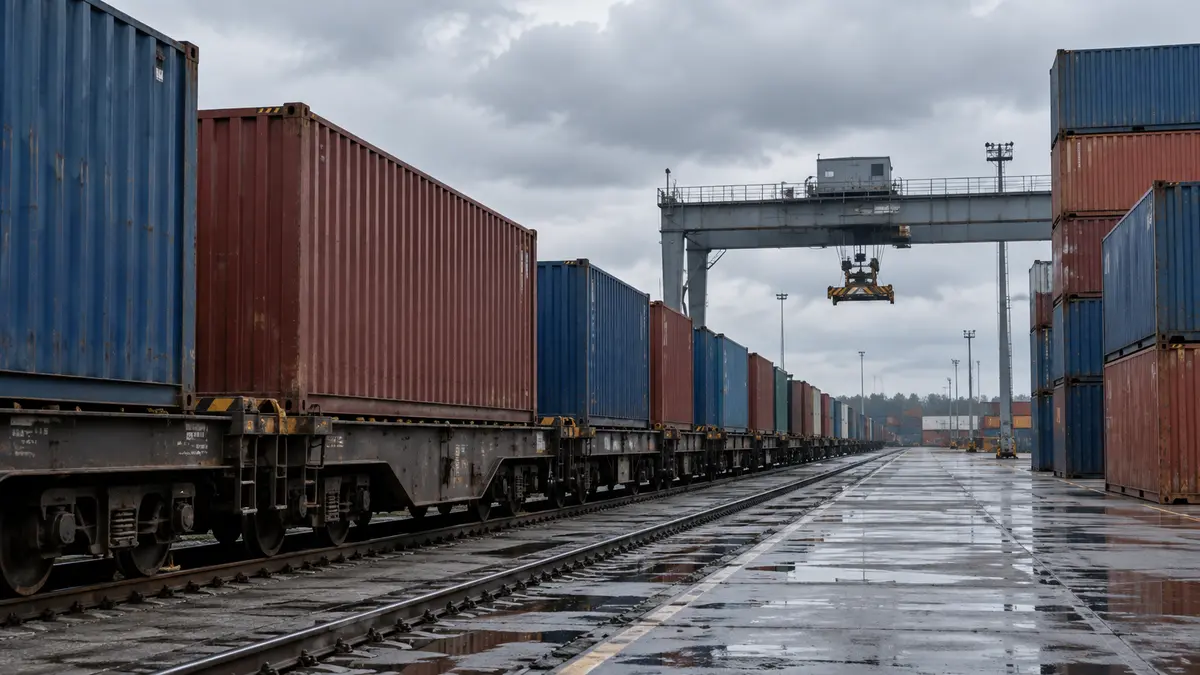
Russia's positive foreign trade surplus fell 8.2% year-on-year in 2025 to $139.3 billion, according to export and import statistics published by the Federal Customs Service (FCS). Exports of goods from Russia declined 3.7% year-on-year to $418.3 billion, while imports decreased 1.4% to $279.0 billion.
In 2024, according to FCS data, the foreign trade surplus stood at $151.7 billion, including exports of $434.5 billion and imports of $282.8 billion. Foreign trade turnover in 2025 amounted to $697.3 billion, down 2.8% from the 2024 figure of $717.3 billion. The contraction thus affected both sides of the trade balance, but exports fell faster than imports, which is why the positive surplus shrank noticeably more than overall turnover.
Trade geography: Asia's share rises, Europe's declines
Asian countries remained Russia's main trading partners in 2025: their share of total trade turnover reached 73.4%, up from 72.6% in 2024, while turnover with them decreased 1.6%. European countries accounted for 18.6% of all trade turnover (19.7% in 2024), with trade falling 8.6%. The share of American countries rose to 4.1% (from 3.7% in 2024), with turnover up 6.3%; the share of African countries was unchanged at 3.9% (3.9% in 2024), while turnover with them decreased 2.4%.
By region, exports to Europe totalled $57.4 billion, down 16.5%; exports to Asia were $326.0 billion, down 1.0%; exports to Africa stood at $22.7 billion (down 6.5%) and to America at $12.1 billion (up 1.4%). Imports from Europe amounted to $72.3 billion (down 1.1%), from Asia $185.9 billion (down 2.7%), from Africa $4.4 billion (up 26.1%) and from America $16.3 billion (up 10.3%).

Mineral products traditionally formed the basis of Russian exports in 2025, with their share in the commodity structure of exports at 53.9% (60.9% in 2024). In the commodity structure of imports, the largest share fell on machinery, equipment and other goods — 48.6% (52.0% in 2024).
Key commodity-structure figures for 2025:
- exports of mineral products — $225.3 billion, down 14.8%;
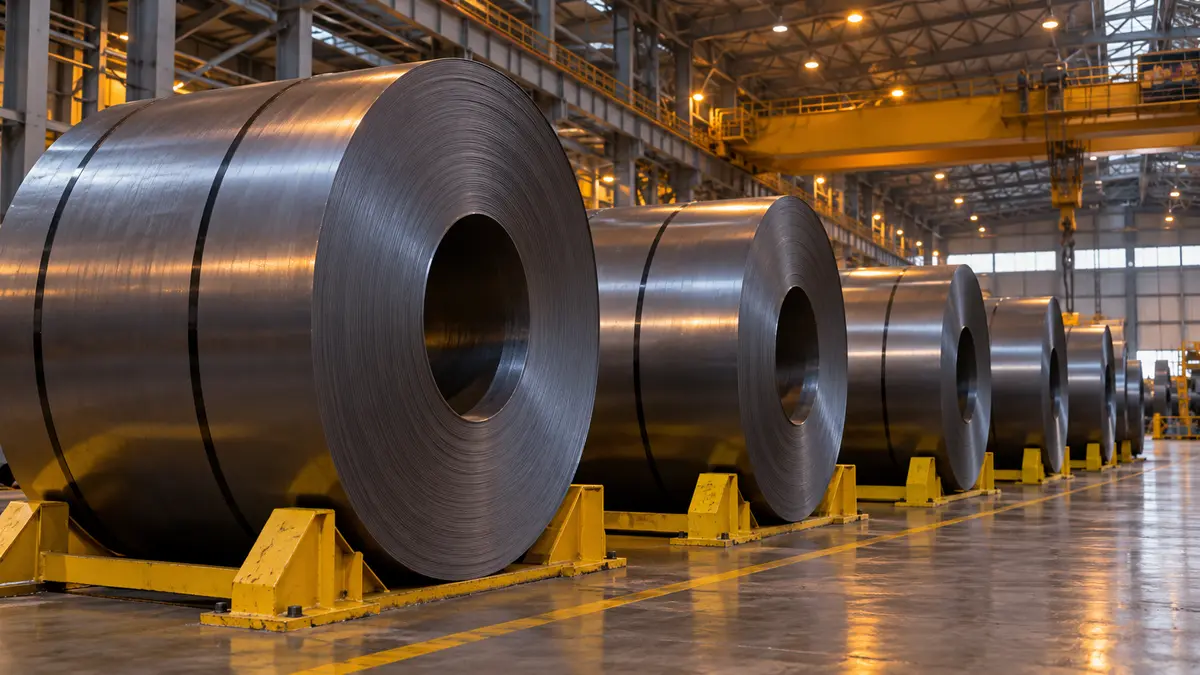
- exports of metals and articles thereof — $74.7 billion, up 17.4%;
- exports of food products and agricultural raw materials — $40.9 billion, down 4.1%;
- exports of chemical industry products — $33.6 billion, up 21.6%;
- exports of machinery, equipment, vehicles and other goods — $29.6 billion, up 26.6%;
- exports of wood and pulp-and-paper articles — $10.6 billion, up 4.9%.
On the import side: machinery, equipment, vehicles and other goods — $135.6 billion (down 7.7%), chemical industry products — $55.5 billion (up 3.8%), food products and agricultural raw materials — $43.4 billion (up 15.0%), textiles, textile articles and footwear — $18.3 billion (up 1.1%), metals and articles thereof — $17.7 billion (down 1.3%).
Thus, in 2025 both exports and imports contracted, and the trade balance surplus narrowed by $12.4 billion. The biggest pressure on export revenue came from the decline in mineral product shipments, while non-resource groups — metals, chemical products and machinery — posted solid growth. Imports of food and chemicals increased, while imports of machinery and equipment continued to fall.

















Leave a comment
Your comment is awaiting moderation.