Fuel Finder on Google Maps: when price transparency becomes useful competition
Fuel Finder brings reported pump prices to Google Maps. The test is whether timely, comparable information helps drivers and strengthens competition.

A price comparison tool becomes part of an everyday journey
The addition of fuel prices to a familiar map changes the location of a purchasing decision. A driver can consider the forecourt before choosing the route, rather than discover the price after arriving. The interesting business question is therefore broader than whether another application can display a cheaper litre. It is whether an open reporting system, distributed through a widely used interface, can make competition easier to exercise without confusing information coverage with guaranteed household savings.
On 8 October 2026, the government announced Fuel Finder integration with Google Maps in the United Kingdom. It described coverage of about 99% of fuel sold and estimated average annual savings of around £40 for car-owning households. Ministers Polly Billington and John Healey endorsed the launch; Google’s Sarah-Jayne Williams described its role in comparison.
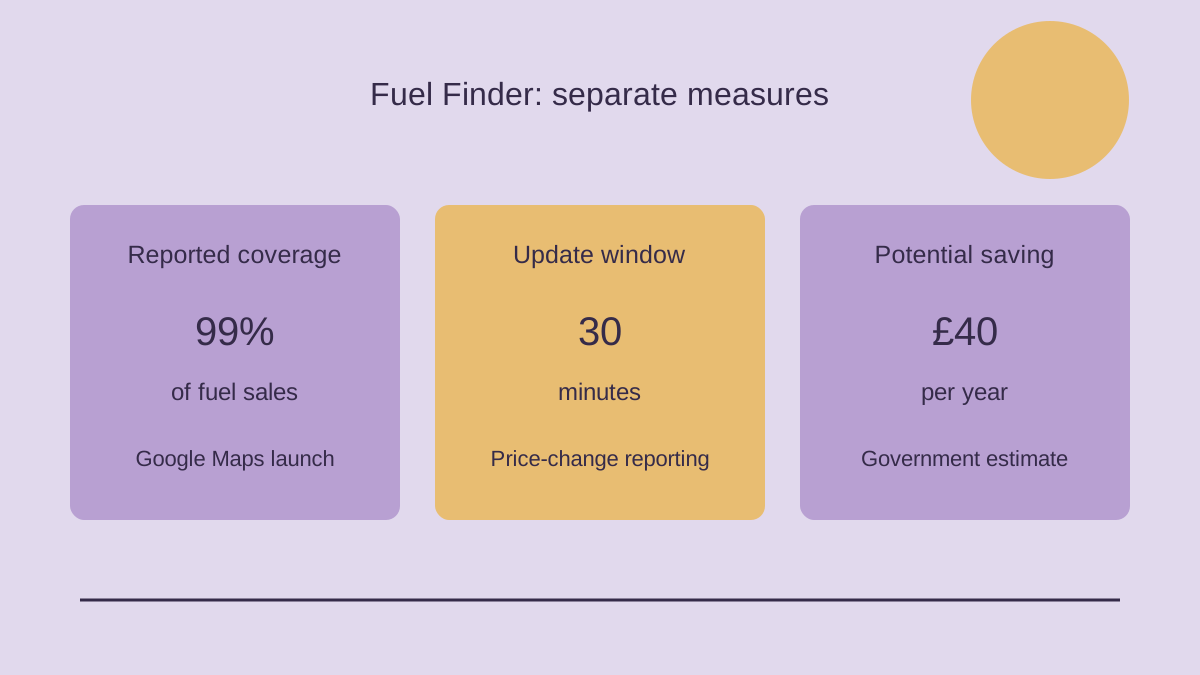
Those are three different kinds of statement: a product introduction, an operational coverage measure and an estimated benefit. Only the first describes something that happened on the announcement date. The savings estimate is not a measured result for every household, and coverage does not mean every consumer will use the information. Keeping these distinctions visible makes the announcement more useful to readers than treating all three statements as proof that prices have already fallen.
The infrastructure beneath the map
The Department for Energy Security and Net Zero’s Fuel Finder collection describes open data available through downloads, subscriptions and an API. Records include fuel type, current price, forecourt address, operator, brand, amenities and time-stamped updates. Traders must report changes within 30 minutes, and users can report discrepancies.
This is an information chain with several responsibilities. A retailer changes the pump price and supplies a record. The central service receives and distributes that record. A comparison provider decides how to present it. The driver then interprets what the display means for a particular journey. A useful interface cannot compensate for an incorrect input, just as an accurate input cannot guarantee that an interface highlights the information a driver needs.
Open access matters because the upstream record can support several downstream services. The public system supplies the common factual ingredient, while applications can compete over route planning, filters, accessibility and presentation. That separation creates room for improvement without requiring each provider to assemble an independent observation network. It also means that problems should be diagnosed at the correct layer. A wrong forecourt price, an outdated display and a route that ignores a road closure are different failures.
Near real time needs a visible time
The reporting window creates a practical limit to the phrase “live prices”. A deadline for sending a change is not the same as a promise that every screen updates instantaneously. A driver should be able to distinguish the time of the underlying price observation from the time an application retrieved it. Otherwise a recently refreshed screen can make an older record look newly verified, even when every system has followed its own operational rules.
For a comparison service, freshness is part of the product rather than a technical detail that can be hidden. Showing when the record changed helps explain why the displayed price and the forecourt board might differ. It also makes a discrepancy report more informative. The issue may concern a mistaken fuel category, a trader’s update, a delayed downstream refresh or an actual new price change after the driver began the journey.
A responsible interpretation avoids two extremes. The possibility of delay does not make the service useless; comparison information can still be substantially better than having none. Equally, a reporting obligation does not justify presenting the data as a binding offer from every retailer. A record can guide a decision while remaining a dated observation. Clear time labels preserve both the value of the service and the consumer’s ability to understand its limits.
Coverage and savings answer different questions
The government’s coverage description uses the amount of fuel sold as its denominator. That should not be silently changed into the percentage of individual forecourts represented. A large station and a small station can contribute differently to sales-weighted coverage. The launch’s operational measure is therefore useful evidence about the reach of the reporting system, but it does not by itself describe the experience of a driver in every locality.
The annual savings estimate requires another set of conditions. Someone must notice a useful difference, choose a suitable alternative and buy enough fuel for the saving to exceed any additional journey cost. A driver whose nearest stations already charge similar prices may obtain information without a large cash benefit. Someone who can choose among several stations on an existing route may find comparison more valuable. These are reasons for heterogeneous outcomes, not numerical predictions about particular households.
Consequently, a meaningful evaluation would report adoption and consumer outcomes separately. Information coverage tells us what can be compared. Usage tells us whether people actually compare. Purchasing behaviour tells us whether the comparison affects where they buy. Net expenditure tells us whether those choices save money after travel costs. A large number at the beginning of that chain cannot stand in for evidence at its end.
The cheapest litre may not be the cheapest purchase
Price ordering is useful, but a journey has more than one relevant cost. The candidate forecourt must sell the fuel the vehicle requires, be accessible from the intended direction and be open when the driver arrives. An alternative can also add distance or interrupt another planned stop. These considerations do not invalidate a low advertised price. They explain why a ranking based solely on the price per litre can differ from the ranking a household would make for the whole purchase.
The appropriate comparison is incremental. If a forecourt lies on a journey that would occur anyway, there is no reason to allocate the entire journey cost to buying fuel there. Conversely, if the price difference motivates a separate detour, the extra distance belongs in the decision. Without making up a vehicle’s consumption or a driver’s time value, the article can identify the structure of the calculation: expected saving on the purchase less the additional cost of obtaining it.
Applications can make this distinction easier by showing alternatives near the intended route rather than simply widening the search radius. A search radius answers a geographical question; a route comparison answers a purchasing question. Neither can decide the consumer’s priorities automatically. A clear product would provide the information needed to make that choice, rather than imply that the lowest displayed number is always the economically best destination.
Retailers face more visible choices, not automatic price cuts
Better visibility can strengthen the reward for offering a lower price because more potential customers can notice the difference. A station that changes its price may become easier to distinguish from neighbouring outlets. This is the intuitive competitive mechanism behind the reporting system. However, the mechanism depends on whether motorists can switch, whether the alternative is convenient and whether the information is used before purchasing.
Visibility also works in the other direction: retailers can observe competitors’ posted prices more easily. For that reason, an application launch alone cannot establish the overall competitive effect. The same infrastructure can make a low-priced outlet easier to find and make rivals’ price changes easier to monitor. Determining which effect dominates requires observed market behaviour rather than assuming that more information has only one possible consequence.
Competition should therefore be assessed through changes in purchasing and pricing over time. If consumers increasingly choose distinct lower-priced options, that would support the proposed switching mechanism. If price differences narrow, the direction of the change matters: a reduction in expensive prices is different from cheaper outlets moving upwards. A comparison display supplies useful observations, but an evaluation must explain which outcome occurred and why the evidence supports its interpretation.
Why monitoring remains a separate function
The Competition and Markets Authority’s monitoring collection distinguishes the Fuel Finder scheme from its market-monitoring function. It identifies VE3 Global Limited as the operator under the Motor Fuel Price (Open Data) Regulations 2025 and describes enforcement powers for reporting non-compliance. Its enhanced reports examine prices, spreads and margins.
Reporting enforcement asks whether the information obligations are being met. Market monitoring asks what the prices and their components reveal about how competition works. These questions are connected but not interchangeable. A retailer can submit accurate information without charging the lowest price, and an inexpensive station can still have a reporting error. A compliance measure should not be presented as a complete judgement on value for consumers.
The distinction also clarifies how public data can support accountability. When records are reliable, analysts can investigate patterns without first reconstructing the basic observations. They must still distinguish retail spreads, operating costs and profits rather than use one as a convenient substitute for another. For readers, the benefit is a clearer argument: the information system enables scrutiny, while the regulator’s analysis explains whether particular behaviour or market conditions warrant further attention.
Distribution can matter as much as another feature
The launch announcement lists existing services including Waze, PetrolPrices, the AA, Confused.com and RAC Fuel Watch. Google Maps therefore joins a distribution network rather than creating the public information from nothing. The change concerns the place in which people encounter it. Information integrated into a journey-planning interface may reach users who would not separately open a specialist fuel application.
That gives specialist providers a reason to differentiate rather than an automatic reason to disappear. They can concentrate on the purchasing problem in ways a broad map may not, while a general navigation service can make basic comparison more convenient. Whether a specialist retains users depends on the value of its experience, not simply on whether another company has access to the same upstream observations.
For the public service, multiple distribution channels also reduce dependence on a single presentation. A reporting scheme can continue to serve drivers even if an application changes its design or priorities. This is one reason to separate the stewardship of the data from the commercial interface. The relationship is complementary when the public record remains usable and providers add understandable, genuinely useful ways of comparing it.
A practical framework for assessing the rollout
Evidence of success should connect the information chain to the purchasing decision. A framework can begin with four concrete questions:
- Are price records accurate for the fuel type and forecourt being displayed?
- Does the interface make freshness, location and availability understandable?
- Can motorists identify useful alternatives on journeys they actually make?
- Do observed purchasing changes translate into lower net expenditure?
These questions require different observations and should be answered separately. A technically complete feed can coexist with weak consumer adoption. Strong usage can coexist with few convenient alternatives. A useful price difference can coexist with a detour that absorbs the saving. Treating those possibilities as separate stages makes it easier to improve the service without announcing success or failure from a single headline metric.
Evaluation should also avoid attributing every movement in pump prices to the new interface. Wholesale conditions, tax changes and local business decisions can change the same outcome. A comparison of periods must identify those influences before drawing a causal conclusion. The useful question is whether the service changes choices relative to the alternatives available, not whether the national price series happened to move after an announcement.
Comparisons need consistent product definitions
A price difference becomes meaningful only after the products have been matched. The data service’s fuel-type field is therefore central to comparison. Two nearby records do not describe interchangeable purchases simply because both come from a forecourt. A useful interface keeps the relevant category visible while a driver moves between map results and a station’s details. Otherwise the information can be numerically accurate and still lead to an unsuitable comparison.
The same discipline applies to the units in which a price is displayed. A consumer should not have to infer whether a large number represents a price per unit or the cost of a proposed purchase. This article does not claim that the launched interface makes either mistake. It identifies a requirement for interpreting its records: the apparent saving needs to concern the same product on the same basis before route costs can sensibly be considered.
Consistent categories also improve evaluation. Analysts investigating purchasing changes need to avoid treating a movement between different products as a change in the price of one unchanged product. Keeping identity, time and comparison basis together helps consumers and researchers for the same reason. It ensures that the numbers describe the decision being examined, rather than a superficially similar transaction.
Data quality is a continuing operating task
Discrepancy reporting creates a feedback path from the forecourt to the information system. Its value depends on whether a report contains enough detail to identify the problem and whether the responsible part of the chain can correct it. Collecting complaints is not the same as resolving them. An operating record would ideally distinguish a confirmed error, a new price change and an issue that belongs to a downstream display.
For retailers, reliable updating is part of the everyday process of changing a price. For comparison providers, reliable ingestion and presentation are part of keeping a useful consumer product. For the public operator, consistent records and an effective correction process preserve confidence in the shared resource. None of these responsibilities becomes unnecessary because the launch reaches a large audience; wider distribution makes failures more visible as well as making the information more useful.
The operational lesson is that a price feed should be judged over repeated use. A successful introduction establishes access. Continued confidence requires understandable timestamps, consistent categories and evidence that errors can be corrected. These are observable features of the service, not reasons to demand impossible perfection before using it. The goal is a comparison resource whose strengths and limits remain clear during ordinary purchasing decisions.
What the announcement establishes
The Guardian’s 8 October coverage identifies the launch as an important consumer-information development. The primary evidence used here is the government’s launch statement, the Fuel Finder operating collection and the CMA monitoring and enforcement collection. They describe the product introduction and its reporting framework; they do not provide a completed evaluation of household outcomes after the launch.
The strongest conclusion available on the historical publication date is therefore about capability. Drivers have another place to compare reported prices, providers share an open information resource, and compliance has an identified monitoring framework. The case for lower expenditure is plausible because comparison can affect purchasing, but its size and distribution remain questions for subsequent evidence.
This is a useful distinction for both public policy and product strategy. The reporting infrastructure lowers the cost of obtaining information; the interface lowers the effort needed to use it. A household benefits when those improvements reveal an alternative that fits its actual journey. Keeping that chain intact gives the rollout a clear standard for assessment and avoids turning a worthwhile information improvement into an unsupported promise about every driver’s future fuel bill.

















Leave a comment
Your comment is awaiting moderation.